

Data Project Checkpoint
Data
This data I found that supports my graph was concluded through a study on ProQuest done by Aaron Michael Randolph. He found more boys played lacrosse than girls, this data can be found on page 13 of the PDF along with all other information about this experiment.
Trend
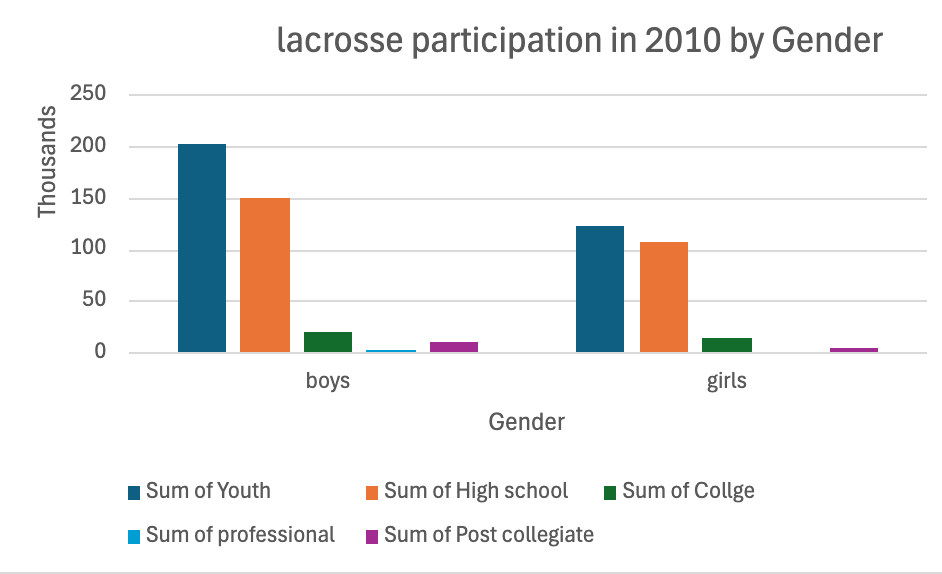
The data set I used was a comparison of gender participation and level of play in America. I was able to conclude that overall boys participated in lacrosse more than girls at all levels. In total 624,593 people played lacrosse in 2010.
The process
I used the data I found online to create an excel work book. I am very familiar with excel because I have used it several times before. I used the data to create a Pivot Table and used that to create the graph bellow. Here is my Excel Data.